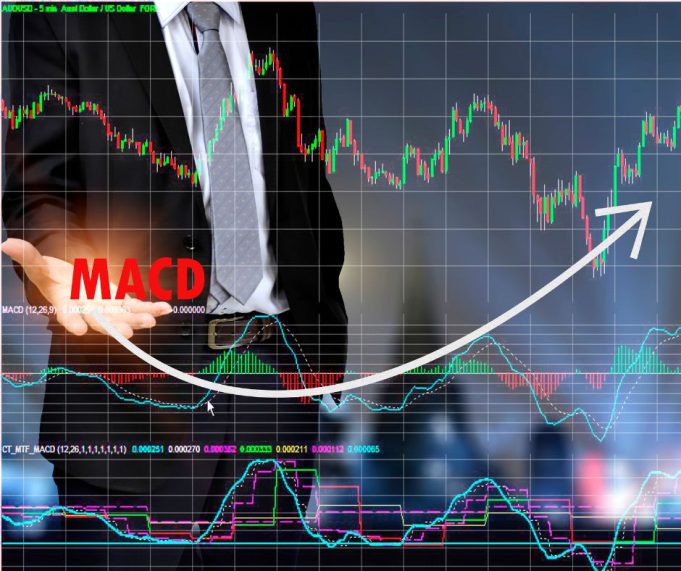
The Moving Average Convergence Divergence (MACD) is a widely used oscillator-type indicator for technical analysis by traders. Developed by Gerald Appel in the late 1970s, the MACD tracks pricing events that have already occurred, making it a lagging indicator that provides signals based on past price action. It is utilized by many traders to spot potential entry and exit points and measure market momentum and possible trends.
The MACD indicator is formed from two exponential moving averages (EMAs) that calculate the average value of previous data (closing prices) during a certain period. The standard MACD settings are 12-period for the faster EMA, 26-period for the slower EMA, and 9-period for the signal line. However, this can be customized for different trading strategies. The MACD line is generated by subtracting the 26-day EMA from the 12-day EMA, and the signal line is obtained from a 9-day EMA of the main line. Additionally, the MACD histogram is a visual representation of the relative movements of the two lines and it is created by subtracting one from the other.
Significant MACD values are associated with centerline and signal line crossovers, which both may happen multiple times and produce many illusory signals. The former occurs when the MACD line crosses above or below the centerline and implies a strong buying or selling momentum, while the latter occur when the MACD line crosses above or below the signal line and are usually deemed as trend reversal signals. Furthermore, MACD also examines divergences between its line and the asset’s price in order to identify potential entry and exit points.
In conclusion, the Moving Average Convergence Divergence indicator is a reliable and an easy to use tool for technical analysis. Although it can provide useful insights, trading solely with the MACD indicator can be risky because it may give off numerous false signals and misleading information, especially if dealing with volatile assets like cryptocurrencies. Therefore, other indicators may be used in conjunction with the MACD to reduce risks and confirm the validity of signals.


